More Information
A selection of indicators for evaluating and communicating ecosystem status
In order to evaluate the effects of fishing on the health status of marine ecosystems, a panel of indicators has been selected by IndiSeas. Three types of indicators are provided to characterize the ecological and biodiversity status of exploited resources, their environment, and the human dimension of fisheries.
Selection criteria
A set of criteria was adopted by IndiSeas to appropriately select, from the multitude of indicators available, a small tractable set of indicators that would help characterize the states and trends of exploited marine ecosystems with respect to fishing activity. The criteria which are listed below correspond to the first screening phase. IndiSeas is currently testing the performance of the selected indicators in support of ecosystem-based fisheries management.
- Theoretical basis: indicators should reflect well-defined ecological, social or economic processes underlying fishing activity. The ecological and human dimension indicators should rely on strong scientific and theoretical knowledge of the links between exploited marine communities, human communities and fishing pressure. Environmental indicators should reflect biological or physical processes that are important drivers of production and condition of the exploited resources.
- Sensitivity: ecological and human dimension indicators should be able to track changes attributable to fishing pressure. Trends in the indicators need to be highly responsive to fishing pressure and their interpretation non-ambivalent.
- Measurability: indicators need to be measurable or estimated on a routine basis, and historical data time-series must be available across the broad spectrum of exploited marine ecosystems under comparison.
- Tractability: the set of indicators must remain tractable, i.e. small. It must permit synthesis of the states and trends of exploited ecosystems, and it must be possible to estimate the set of indicators (i) for an extended range of ecosystems, (ii) with annual updates. Redundancy of indicators should be avoided as much as possible.
- General public awareness: the meaning of the indicator and its link with fishing needs to be widely and intuitively understood.
Ecological indicators
These indicators were selected to reflect the ecological and biodiversity status of marine ecosystems, and the effects of fishing on ecosystem functions and properties (production of biomass, stability over time, resistance to perturbations). Current states and recent trends of indicators are provided. Good ecological status of ecosystems are characterized by high values of indicators (pie plots), and improvement corresponds to positive trends in indicators (in green in the bar plots).
Among the nine ecological indicators (Table 1), six indicators are used to evaluate the current state of exploited ecosystems (S), and seven indicators for the recent trends. Data for the indicators are derived primarily from fisheries independent surveys and a few from commercial fisheries data.
In addition to the full indicator name, a shorter “headline label” was attributed to each of the indicators to make them more readily comprehensible. Furthermore, the indicators are all formulated positively so that a low value of an indicator means a high impact of fishing and a high value a low impact of fishing. Similarly, an increase of the indicator means an improving state, whereas a decrease means a deteriorating state.
Table 1: List of ecological indicators with corresponding management objectives (L: length (cm), i: individual, s: species, N: abundance, B: biomass, Y: catch, TL: trophic level, IVI: intrinsic vulnerability index).
|
Indicators |
Headline label |
Calculation, notations, units |
Used for state (S), trend (T) |
|---|---|---|---|
|
Total biomass of surveyed species |
biomass |
B (tons) |
T |
|
1/(landings /biomass) |
inverse fishing pressure |
B/Y retained species |
T |
|
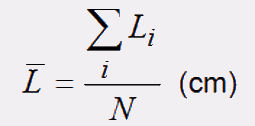
Mean length of fish in the community |
fish size |
|
S, T |
|
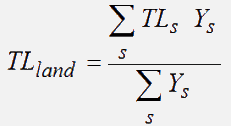
TL landings |
trophic level |
|
S, T |
|
Proportion of non-fully exploited stocks |
% sustainable stocks |
number (non-fully exploited stocks)/total no. of stocks considered |
S |
|
Proportion of predatory fish |
% predators |
prop predatory fish= B predatory fish/B surveyed |
S, T |
|
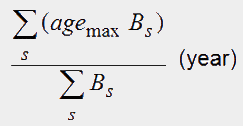
Mean life span |
life span |
|
S, T |
|
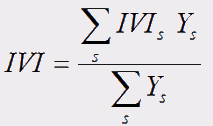
Intrinsic vulnerability Index of the landings |
vulnerability |
|
T |
|
1/Coefficient of variation of total biomass |
biomass stability |
mean(total B for the last 10 years) /sd(total B for the last 10 years) |
S |
Total biomass of surveyed species - total biomass of fish in the ecosystem is expected to decrease under fishing pressure. However, interpretation should be made with caution; in some cases, as species are fished and their biomass reduced, other species might increase in abundance and “replace” these species in the foodweb. For example, with the removal of top predators, lower trophic levels can be expected to increase. “Biomass” was not used to characterise the ecosystem state since survey data does not provide absolute estimates of biomass and thus is not comparable between species or ecosystems (due to differences in species catchability and surveys spatio-temporal coverage). Instead, “biomass” was used to compare biomass trends over time.
1/(landings /biomass) measures the inverse level of exploitation or total fishing pressure on the ecosystem. This indicator varies in the same direction as the other indicators in the selected suite, as it decreases when fishing pressure increases. A decrease is considered negative for the exploited ecosystem. As for total biomass, this indicator is only used for comparison of trends since absolute estimates of biomass are generally not available.
Mean length of fish in the community is expected to decrease under fishing pressure for several reasons: (i) high-value and target species are generally large; (ii) fishing gears are size selective and often designed to remove larger fish and allow smaller ones to escape; (iii) older (and larger) fish in a population become fewer, because they accumulate the effects of fishing mortality through time; (iv) large sized species are more vulnerable because they have lower potential rates of increase. Mean length of fish is a measure of ecosystem functioning. From a single species perspective, the removal of larger fish, which are more fecund and produce more viable eggs than smaller fish, compromises productivity. From an ecosystem perspective, the removal of larger species changes the size structure of the community and potentially the predator-prey interactions.
Trophic level of landings measures the average trophic level of species exploited by the fishery, and is expected to decrease in response to fishing, since fisheries tend to target higher trophic level species. A decrease in trophic level of landings and total catch indicates “fishing down the food web”, and a change in the structure of the community and potentially ecosystem functioning. Trophic level of individual species is either estimated through modelling, or taken from global database such as Fishbase.
Proportion of predatory fish is a measure of the diversity of fish in the community. Predatory fish are all surveyed fish species that are piscivorous, or feeds on invertebrates that are larger than 2 cm. The role of predators is important in an ecosystem as they regulate the abundance of the lower trophic level species, and thay dampen the effects of environmental variability.
Proportion of non-fully exploited stocks reflects the success (or not) of fisheries management. Ideally, in a precautionary world and from a conservation point of view, all stocks should be non-fully exploited to ensure sustained biodiversity and sustainable ecosystems. “% of sustainable stocks” is a measure of conservation of biodiversity. The FAO classification of stocks as non-fully exploited (http://www.fao.org/docrep/015/i2389e/i2389e.pdf, part D) was used. This classification was further reviewed and potentially refined adding local expert knowledge. This indicator is used to compare the state of ecosystems.
Intrinsic vulnerability index (IVI) of the landings. The intrinsic vulnerability index of a species (IVIs) is based on life history traits and ecological characteristics, and ranges from 0 to 100, with 100 being most vulnerable. IVI of the landings is the mean IVI across all species landed, weighted by the contribution of each species to the landed catch. It is used as a trend indicator.
Mean life span is a proxy for mean turnover rate of species and communities, and is meant to reflect the buffering capacity of a system. The life span or longevity is a fixed parameter per species, and therefore the mean life span of a community will reflect the relative biomass of species with differential turnover rates. Fishing affects the longevity of a given species (direct effect of fishing and genotype selection), but the purpose here is to track changes in species composition (same principle as for mean TL of catch). “Life span” is a measure of ecosystem stability and resistance to perturbations and is used to measure state and trend.
1/Coefficient of variation of total biomass reflects the stability of the ecosystem, and is measured as the inverse of the coefficient of variation (CV) over the last 10 years. As with “fishing pressure”, it is expressed as an inverse to make it conform with the directionality of the other indicators. Thus a low 1/CV indicates low “biomass stability”. Since this indicator is measured over a 10 year time period, it is only used to measure state.
Species considered in the calculation of indicators
Surveyed species
These are species sampled by researchers during routine surveys (as opposed to species sampled in catches by fishing vessels), and include species of demersal and pelagic fish (bony and cartilaginous, small and large), as well as commercially important invertebrates (squids, crabs, shrimps…). Intertidal and subtidal crustaceans and molluscs such as abalones and mussels, mammalian and avian top predators, and turtles, are excluded. Surveyed species are those that are considered by default in the calculation of all survey-based indicators.
Retained species (landed)
These are species caught in fishing operations, although not necessarily targeted by a fishery (i.e. include by-catch species), and which are retained because they are of commercial interest, i.e. not discarded once caught, although this does not imply that sometimes certain size classes of that species may be discarded. A non-retained species is considered to be one that would never be retained for consumptive purposes. Intertidal and subtidal crustaceans and molluscs such as abalones and mussels are to excluded. Retained species are those that are considered by default in the calculation of all catch-based indicators.
Predatory fish species
Predatory fish are considered to be all surveyed fish species that are not largely planktivorous (i.e. phytoplankton and zooplankton feeders should be excluded). A fish species is classified as predatory if it is piscivorous, or if it feeds on invertebrates that are larger than the macrozooplankton category (> 2cm). Detritivores are not classified as predatory fish.
Environmental indicators
The ecological status of marine exploited resources is affected by fishing activity, but is also strongly dependent on the environment. Here we consider two simple environmental indicators to characterize marine ecosystems states and trends, and to allow for inter-systems comparisons.
SST, Sea Surface Temperature
Sea surface temperature (SST) is associated with variations in the rate of growth and metabolism and the distribution and survival of exploited fish, their predators and prey. SST forms an important climatic variable to monitor given its influence on bottom-up and top-down processes which affect the productivity of fish populations and our ability to survey them. SST values derived from the standard 4km Pathfinder v5.2 AVHRR satellite sensor data are shown to highlight differences between systems.
Chl a, Chlorophyll a, the concentration of the main phytoplankton pigment in surface waters
Chlorophyll a (Chl a) is associated with the biomass of phytoplankton which either directly or indirectly supports all life stages of exploited fish species. High mean Chl a (e.g. > 1mg Chla/m3) are generally associated with productive ecosystems which have ample access to nutrients and light, whereas low mean Chl a concentrations imply that the availability of phytoplankton resources to support fisheries may be limited. The availability of phytoplankton resources has the potential to affect the productivity of fish populations and their distribution, consequently Chl a forms an important environmental variable to monitor. Mean surface Chl a values (derived from the application of the standard Case 1 water algorithm OC3M product to 4km MODIS Aqua spectral data) are shown to highlight potential productivity differences between systems.
Human Dimension indicators
On the assumption that the overall goal of the ecosystem approach to fisheries management is to achieve lasting benefits of fisheries to society, IndiSeas selected a suite of indicators to provide evidence in support of this by evaluating the following 4 sub-goals:
- Effectiveness and efficiency of fisheries management
- Quality of governance
- Contribution of fisheries to broader society
- Wellbeing and resilience of fisher communities
1. Effectiveness and efficiency of fisheries management refers to how well fisheries are managed in the ecosystem. It measures how frequently stock assessments are carried out, whether reference points are used, whether there is an attempt to rebuild depleted stocks, the frequency with which management measures are reviewed, whether ecosystem impacts are considered in the assessment, and whether illegal fishing is controlled.
2. Quality of governance is a measure of how well the ecosystem is being governed. Governance is fundamental to fisheries, determining the manner in which power and influence are exercised over the management of fisheries resources. We provide a measure of whether the fishery is managed to reduce conflict, whether there are long term management objectives, whether these include social and economic considerations, and whether participation of the harvesting sector a requirement in fisheries management.
We rely on expert knowledge to provide the information required for the indicators of these first two sub-goals. A questionnaire was developed and completed by the relevant experts from the IndiSeas ecosystems. The questions were designed to be objective and experts were asked to provide evidence in support of their response. A score of 1-5 (poor to good) was used for each question and the responses were averaged to provide indicators of “Effectiveness and efficiency of fisheries management” and “Quality of governance”. A copy of the questionnaire is provided in Table 2.
3. Contribution of fisheries to broader society is a measure of the overall benefits that fisheries can bring to the wider society. Here we use measures of the economic and social contributions of fisheries to society, including the contribution of fisheries to food security.
4. Wellbeing and resilience of fisher communities: wellbeing essentially refers to living standards of fishers (materially, in terms of their relations with others, and their perception of quality of life) and resilience is the ability of fisher communities to respond to, and recover from change. These are both complex concepts and here we have used simple measures of economic viability (wellbeing) and opportunity to diversify (resilience).
“Contribution of fisheries to broader society” and “Wellbeing and resilience of fisher communities” were assessed using the social and economic indicators provided in Table 3. These indicators are derived from national data since this type of data rarely exists at the ecosystem level. The indicators were standardised then averaged (equal weighting) to provide an overall score for the two sub-goals, “Contribution of fisheries to broader society” and “Wellbeing and resilience of fisher communities”.
Table 2. IndiSeas Expert Survey to assess the effectiveness and efficiency of management, and quality of governance
|
Assess the effectiveness and efficiency of management |
|---|
|
1. How frequently are stock assessments* carried out in your fishery or fishery sector? |
|
2. Are limit reference points*, thresholds*, or other targets*, set and used for the management of commercial stocks and/or species at risk? |
|
3. Are depleted stocks* or species* being successfully rebuilt? |
|
4. Are management measures* being reviewed frequently enough to maximise the prospect that the management intentions** are met? |
|
5. Are ecosystem impacts* of fishing assessed, and are they being addressed? |
|
6. Is Illegal*, Underreported** and Unregulated*** (IUU) fishing being addressed by management? |
|
Assess Quality of Governance |
|---|
|
7. Is this fishery managed so as to minimize conflict* with other fishery sectors? |
|
8. Does the fishery or fishery sector management plan have long term objectives*? |
|
9. Are the social impacts of the fisheries management plan considered and formally evaluated in management decisions? |
|
10. Are economic impacts of the fisheries management plan considered and evaluated in management decisions? |
|
11. Is the participation of the harvesting sector a requirement in fisheries management? v. Required, involves full exchange of information and input to management decisions.
|
Table 3. Macro indicators for “Contribution of fisheries to broader society” and “Well-being and resilience of fisher communities”
|
CONTRIBUTION OF FISHERIES TO BROADER SOCIETY |
|||
|
Objective |
Descriptive measure |
Indicator |
Used for State or Trend |
|
Economic contribution to society |
Landed value in relation to GDP |
Total landed value of marine fisheries as % of GDP |
S, T |
|
|
Fisheries GDP compared to GDP |
Fisheries GDP as % of GDP |
S, T |
|
|
Fisheries Exports |
Value of fish export value as % of total export value. |
S, T |
|
Socio-economic contribution to society |
Employment |
Number of fishermen (direct + indirect) as % of economically active population (EAP) |
S |
|
Contribution to food security |
Fish as a proportion of total protein consumed |
Fish protein intake as % of total animal protein intake. |
S, T |
|
Total protein intake |
Total protein consumed |
Per capita consumption per year |
T |
|
WELLBEING AND RESILIENCE OF FISHER COMMUNITIES |
|
||
|
Fisher's wellbeing |
Relative economic viability |
Fishery wages compared to non-fishery wages |
S |
|
Fisher's capacity to adapt / resilience |
Opportunity to diversify |
Rate of economic growth (% GDP) |
S, T |
|
|
|
# alternative sectors for employment |
S |
|
|
|
Rate of total employment |
S, T |
|
|
|
Rate of change in fisheries jobs |
S, T |
Representation of the Indicators
Images help to describe, explain and to synthesize information. As such, they are ideal tools for conveying and synthesising the information from a suite of ecosystem indicators such as those described here. We have developed a “generic dashboard” to present the ecosystem indicators describing the state of ecosystems and the trends within them, using pie diagrams and simple bar plots. The advantage of such simple representations lies in providing a multivariate view of the ecosystem.
Pie diagrams were used to present the state indicators which are averaged over the last three years of data to represent the current state of the ecosystem. Each pie corresponds to a selected indicator. Each indicator is scaled between a minimum value (centre of the diagram) and a maximum value which are determined by the minimum and maximum values observed in the set of ecosystems. The purpose of the boundaries is to scale the indicators for graphical representation, and to allow for comparisons across ecosystems.
Short to medium terms trends were calculated over a 10 year period for the suite of seven standardized trend indicators. Bar plots were used to represent the trends which were significant, green indicating an increase, and orange a decrease. Grey bars represent trends which are not significant statistically.
IndiSeas Publications
Shin Y.-J., Houle J.E., Akoglu E., Blanchard J., Bundy A., Coll M., Demarcq H., Fu C., Fulton E.A., Heymans J.J., Salihoglu B., Shannon L.J., Sporcic M., Velez L. 2018. The specificity of marine ecological indicators to fishing in the face of environmental change: a multi-model evaluation. Ecological Indicators 89: 317-326. https://doi.org/10.1016/j.ecolind.2018.01.010M.
Fu C., Travers-Trolet M., Velez L., Grüss A., Bundy A., Shannon L.J., Fulton E.A., Akoglu E., Houle J.E., Coll M., Verley P., Heymans J.J., John E., Shin Y.-J. 2018. Risky business: the combined effects of fishing and changes in primary productivity on fish communities. Ecological Modelling, 368: 265-276.
Reed J., Shannon L.J., Velez Akoglu E., Bundy A., Coll M., Fu C., Fulton E.A., Grüss A., Halouani G., Heymans J.J., Houle J., John E., Le Loc'h F., Salihoglu B., Verley P., Shin Y.-J. 2017. Ecosystem indicators – accounting for variability in species’ trophic levels. ICES Journal of Marine Science. 74(1): 158-169.
Bundy A., Chuenpagdee R., Boldt J.L., Borges M.F., Lamine Camara M., Coll M., Diallo I., Fox C., Fulton E.A., Gazihan A., Jarre A., Jouffre D., Kleisner K.M., Knight B., Link J., Matiku P.P., Masski H., Moutopoulos D.K., Piroddi C., Raid T., Sobrino I., Tam J., Thiao D., Torres M.A., Tsagarakis K., van der Meeren G.I., Shin Y.-J., 2017. Strong fisheries management and governance positively impact ecosystem status. Fish and Fisheries, 18: 412-439.
Coll, L. J. Shannon, K. M. Kleisner, M. J. Juan Jordà, A. Bundy, A.G. Akoglu, D. Banaru, J. L. Boldt, M.F. Borges, A. Cook, I. Diallo, C. Fu, C. Fox, D. Gascuel, L.J. Gurney, T. Hattab, J.J. Heymans, D. Jouffre, B.R. Knight, S. Kucukavsar, S. I. Large, C. Lynam, A. Machias, K. N. Marshall, H. Masski, H. Ojaveer, C. Piroddi, J. Tam, D. Thiao, M. Thiaw, M.A. Torres, M. Travers-Trolet, K. Tsagarakis, I. Tuck, G.I. van der Meeren, D. Yemane, S. G. Zador, Y.J. Shin. 2016. Ecological indicators to capture the effects of fishing on biodiversity and conservation status of exploited marine ecosystems. Ecological Indicators 60: 947-962.
Kleisner KM, Coll M, Lynam CP, Bundy A, Shannon L, Shin YJ, Boldt JL, Borges MF, Diallo I, Fox C, Gascuel D, Heymans JJ, Juan Jorda MJ, Jouffre D, Large SI, Marshall KN, Ojaveer H, Piroddi C, Tam J, Torres MA, Travers-Trolet M, Tsagarakis K, van der Meeren GI, Zador S, 2015. Identifying community changes across marine ecosystems based on the proportion of species with declining biomass. Ecosystem Services. In press. http://dx.doi.org/10.1016/j.ecoser.2015.02.002.
Fu C., Large S., Knight B., Richardson A.J., Bundy A., Reygondeau G., Boldt J., van der Meeren G.I., Torres M.A., Sobrino I., Auber A., Travers-Trolet M., Piroddi C., Diallo I., Jouffre D., Mendes H., Borges M.F., Lynam C.P., Coll M., Shannon L.J., Shin Y.-J. 2015. Relationships among fisheries exploitation, environmental conditions, and ecological indicators across a series of marine ecosystems. Journal of Marine Systems 148: 101-111.
Shannon L., Coll M., Bundy A., Gascuel D., Heymans J.J., Kleisner K., Lynam C.P., Piroddi C., Tam J., Travers-Trolet M., Shin Y.-J. 2014. Trophic level-based indicators to track fishing impacts across marine ecosystems. MEPS 512: 115-140.
Bundy A., Coll M., Shannon L.J., Shin Y.-J. 2012. Global assessments of the status of marine exploited ecosystems and their management: what more is needed? Current Opinion in Environmental Sustainability 4: 292-299.
Shin Y.-J., Bundy A., Shannon L.J., Blanchard J.L., Chuenpagdee R., Coll M., Knight B., Lynam C., Piet, G., Richardson A.J., the IndiSeas Working Group 2012. Global in scope and regionally rich: an IndiSeas workshop helps shape the future of marine ecosystem indicators. Reviews in Fish Biology and Fisheries, 22(3): 835-845.
Blanchard, J.L., Coll, M., Trenkel, V.M., Vergnon, R., Yemane, D., Jouffre, D., Link, J.S., and Shin, Y.-J. 2010. Trend analysis of indicators: a comparison of recent changes in the status of marine ecosystems around the world. ICES Journal of Marine Science, 67: 732-744.
Bundy, A., Shannon, L.J., Rochet, M.-J., Neira, S., Shin, Y.-J., Hill, L., and Aydin, K. 2010. The Good(ish), the Bad and the Ugly: a tripartite classification of ecosystem trends. ICES Journal of Marine Science, 67: 745-768.
Coll, M., Shannon, L.J., Yemane, D., Link, J.S., Ojaveer, H., Neira, S., Jouffre, D., Labrosse, P., Heymans, J.J., Fulton, E.A., and Shin, Y.-J. 2010. Ranking the ecological relative status of exploited marine ecosystems. ICES Journal of Marine Science, 67: 769-786.
Jouffre, D., Borges, M. F., Bundy, A., Coll, M., Diallo, I., Fulton, E. A., Guitton, J., et al. (2010). Estimating EAF indicators from scientific trawl surveys: theoretical and practical concerns. ICES Journal of Marine Science, 67: 796-808.
Link, J.S., Yemane, D., Shannon, L.J., Coll, M., Shin, Y.-J., Hill, L., and Borges, M.F. 2010. Relating marine ecosystem indicators to fishing and environmental drivers: an elucidation of contrasting responses. ICES Journal of Marine Science, 67: 787-795.
Shannon, L.J., Coll, M., Yemane, D., Jouffre, D., Neira, A., Bertrand, A., Diaz, E., and Shin, Y.-J. 2010. Comparing data-based indicators across upwelling and comparable systems for communicating ecosystem states and trends. ICES Journal of Marine Science, 67: 807-832.
Shin, Y.-J., and Shannon, L.J. 2010. Using indicators for evaluating, comparing and communicating the ecological status of exploited marine ecosystems. Part 1: the IndiSeas Project. ICES Journal of Marine Science, 67: 686-691.
Shin, Y.-J., Shannon, L.J., Bundy, A., Coll, M., Aydin, K., Bez, N., Blanchard, J.L., Borges, M.F., Diallo, I., Diaz, E., Heymans, J.J., Hill, L., Johannesen, E., Jouffre, D., Kifani, S., Labrosse, P., Link, J.S., Mackinson, S., Masski, H., Möllmann, C., Neira, S., Ojaveer, H., Ould Mohammed Abdallahi, K., Perry, I., Thiao, D., Yemane, D., and Cury, P.M. 2010. Using indicators for evaluating, comparing and communicating the ecological status of exploited marine ecosystems. Part 2: Setting the scene. ICES Journal of Marine Science, 67: 692-716.
Shin, Y.-J., Bundy, A., Shannon, L.J., Simier, M., Coll, M., Fulton, E.A., Link, J.S., Jouffre, D., Ojaveer, H., Mackinson, S., Heymans, J.J., and Raid, T. 2010. Can simple be useful and reliable? Using ecological indicators to represent and compare the states of marine ecosystems. ICES Journal of Marine Science, 67: 717-731.